Project Management
/Project Resource Forecast
Project Resource Forecast
The Project Resource Forecast module provides comprehensive resource allocation and capacity planning for project teams. This tool enables real-time tracking of employee workload across projects with visual warnings for over-capacity situations. All data entered or deleted is saved immediately to the database.
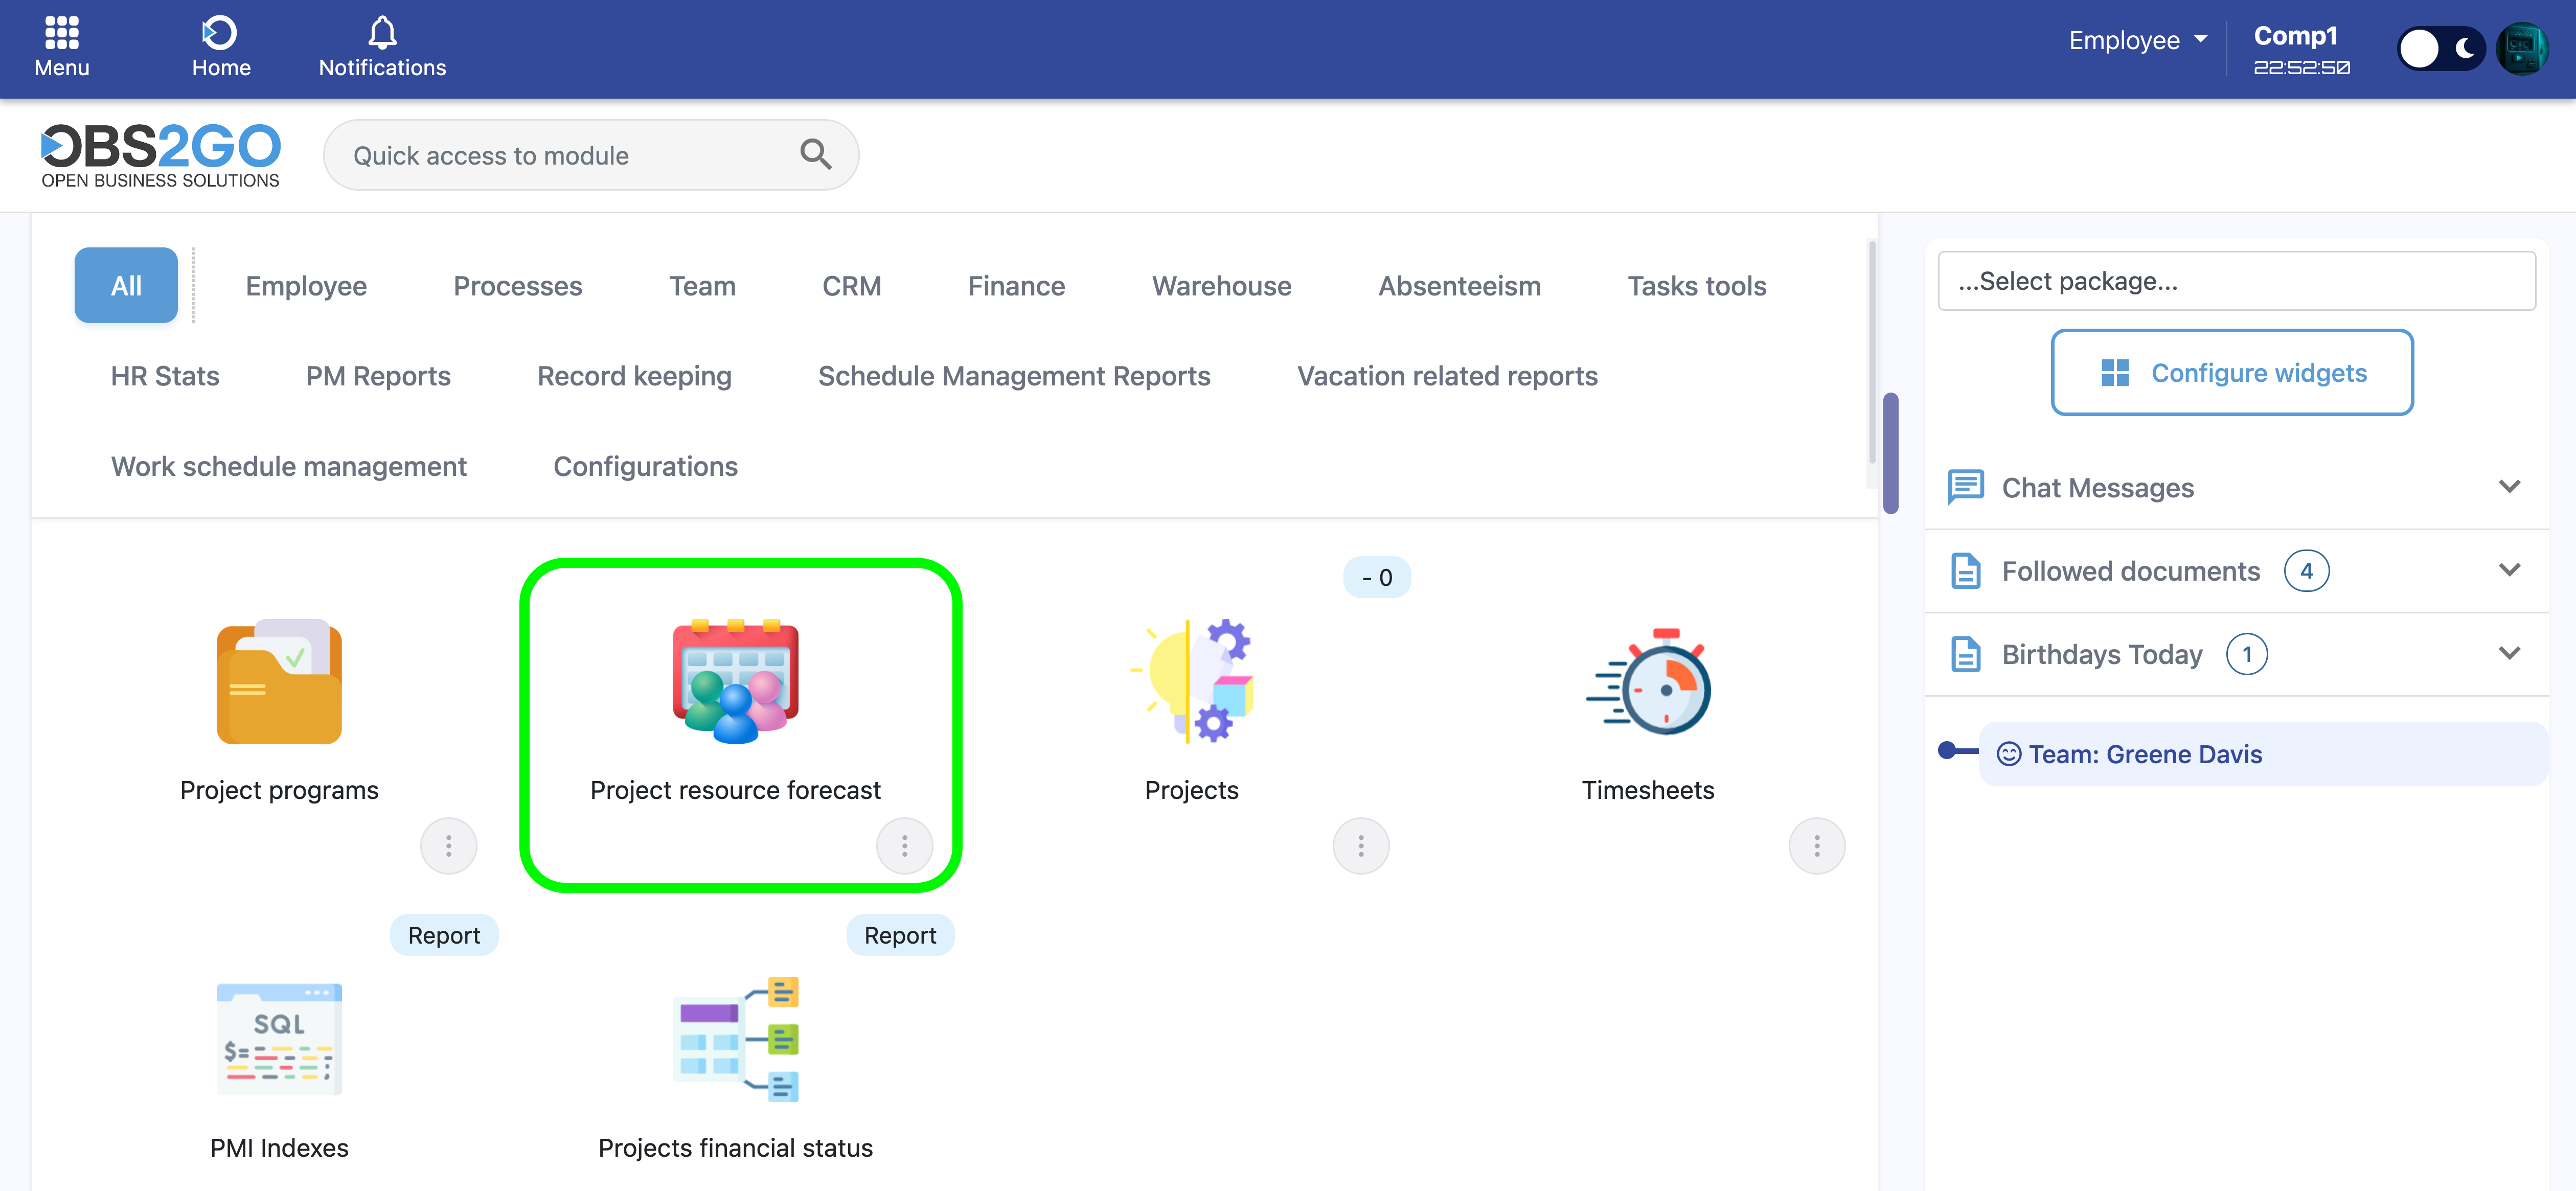
Navigation: Home screen > Project Resource Forecast
1. What You See When You Open Project Resource Forecast
When you first access Project Resource Forecast, the system automatically displays specific data based on your organizational hierarchy and active project assignments.
1.1 Team Scope
- Direct reports: All employees who report directly to you.
- Indirect reports: All employees in your hierarchy (reports of reports, recursively through the entire tree).
- Time tracking enabled only: Only employees with time tracking obligations enabled are included.
- You are excluded: Your own record does not appear in the forecast view.
1.2 Project Visibility
- Active assignments only: Projects where employees have active task assignments (via tasks.assignee or task_invites).
- Existing forecast data: Projects with existing forecast entries within the selected date range.
- Status filtering: Only projects that are not marked as "Completed" or "Cancelled".
1.3 Default Date Range
The system defaults to a three-month view: current month plus the next two months. This range can be modified at any time using the date range filters in the header section.
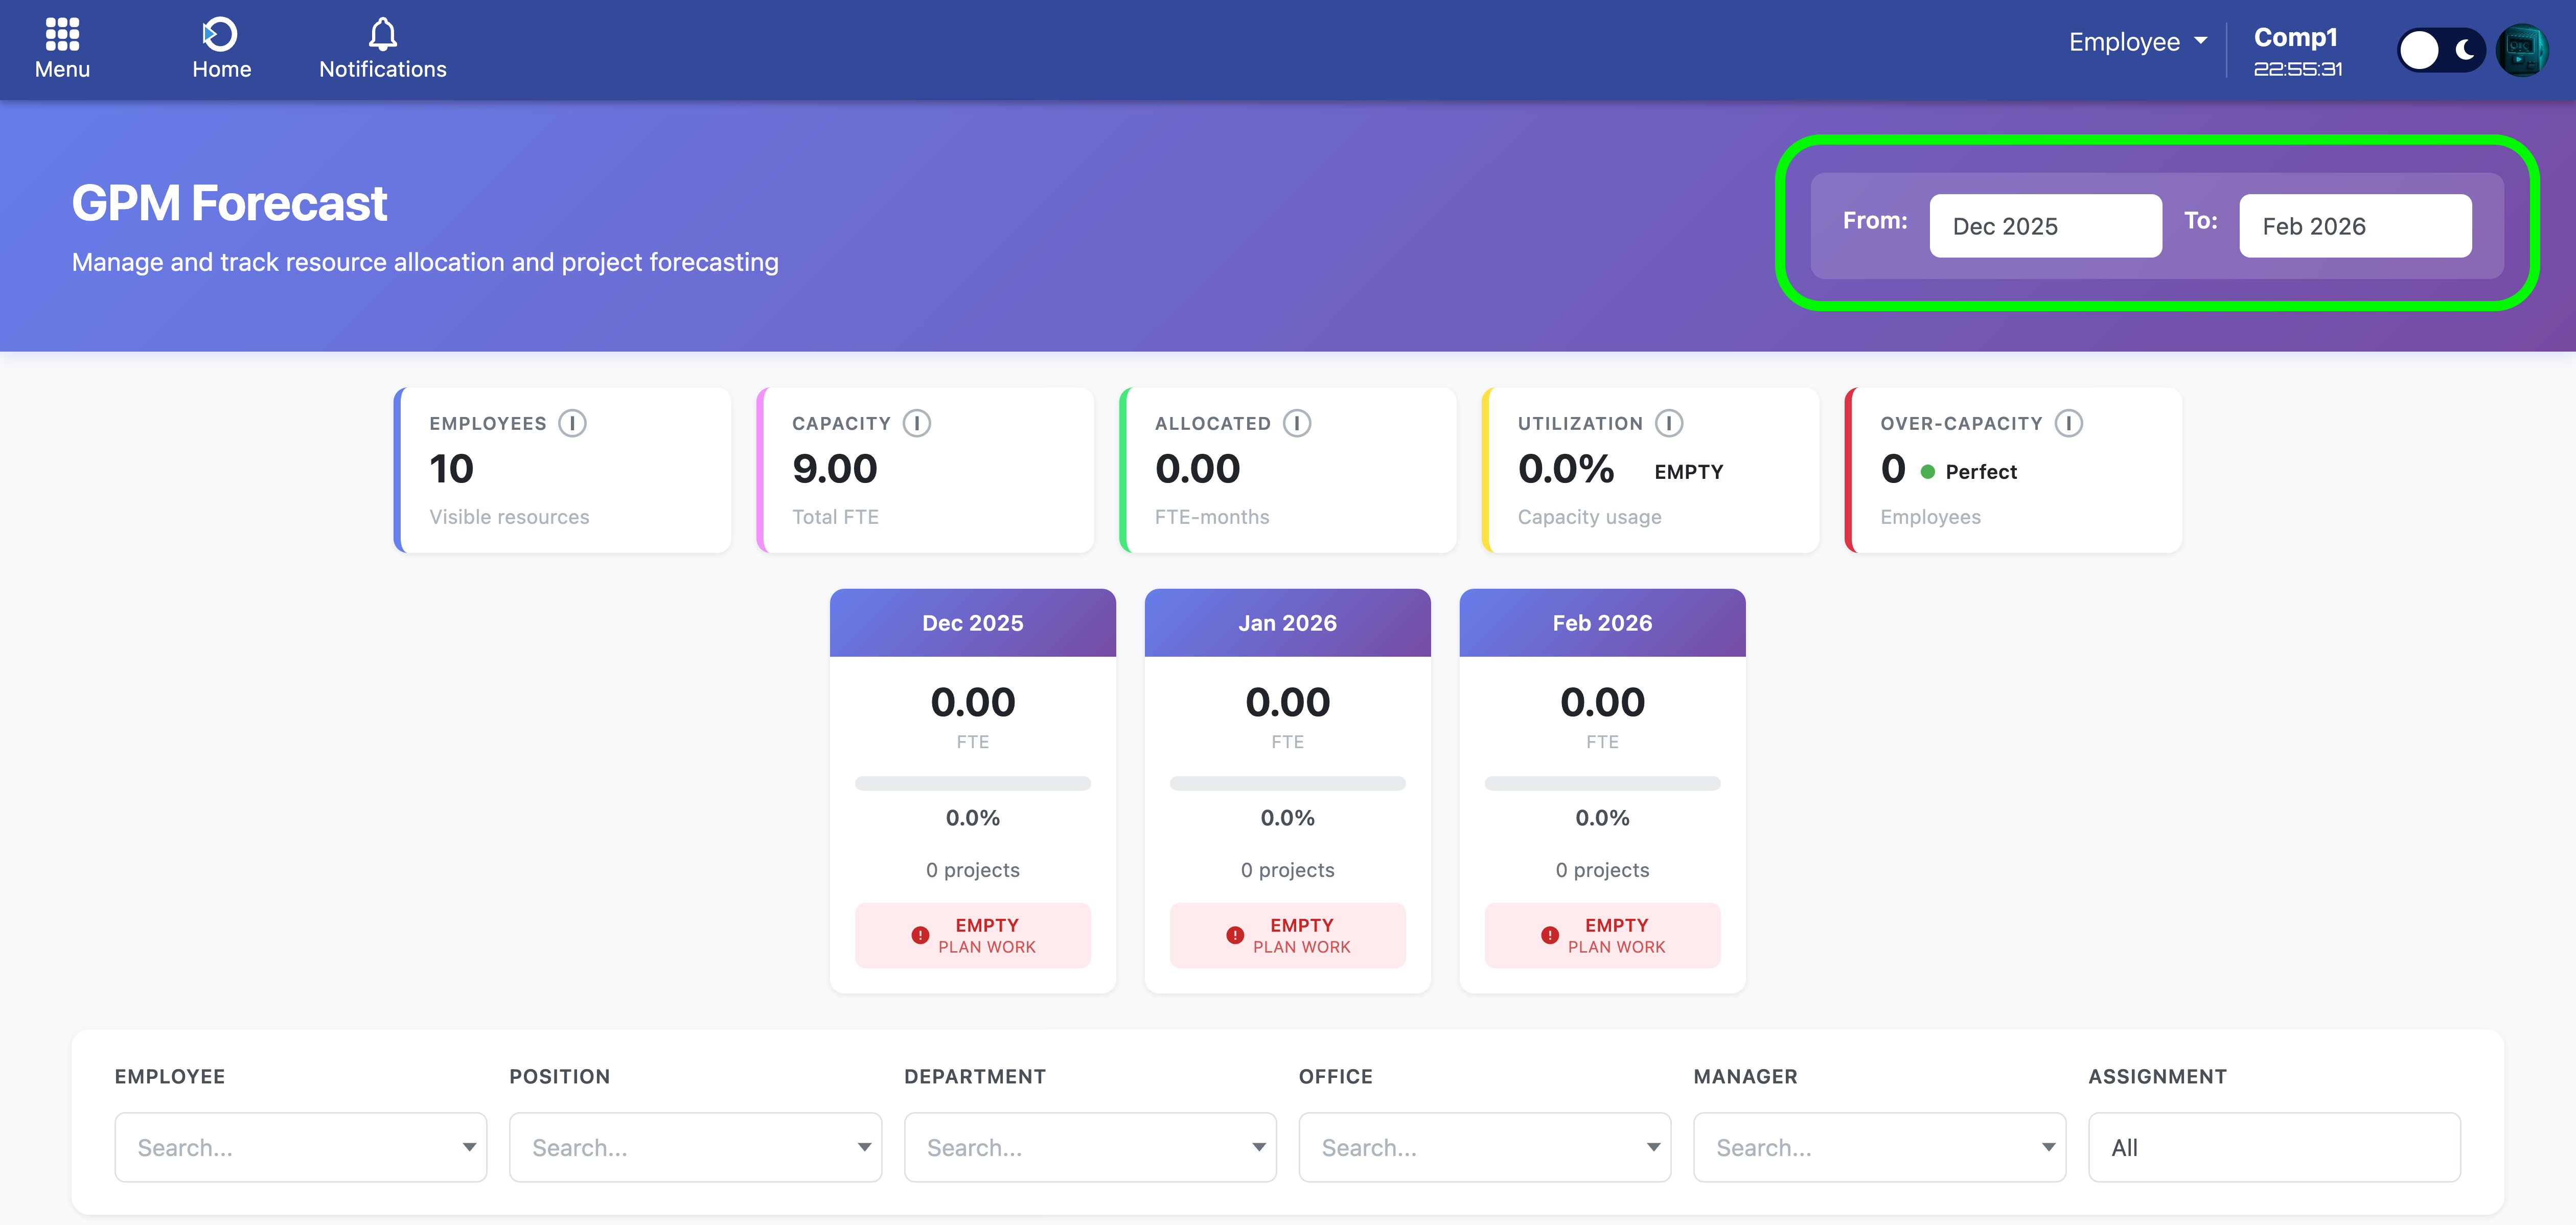
Navigation: Header section date filters
2. Page Layout and Components
The Project Resource Forecast interface is organized into five main sections, arranged vertically from top to bottom.
2.1 Header Section
Located at the top of the page with a purple gradient background. Contains the module title, subtitle, and date range controls.
- Title: "Project Resource Forecast"
- Subtitle: Brief description of module functionality
- From date selector: Choose the starting month for the forecast range
- To date selector: Choose the ending month for the forecast range
Changes to the date range take effect immediately upon selection, triggering a data refresh.
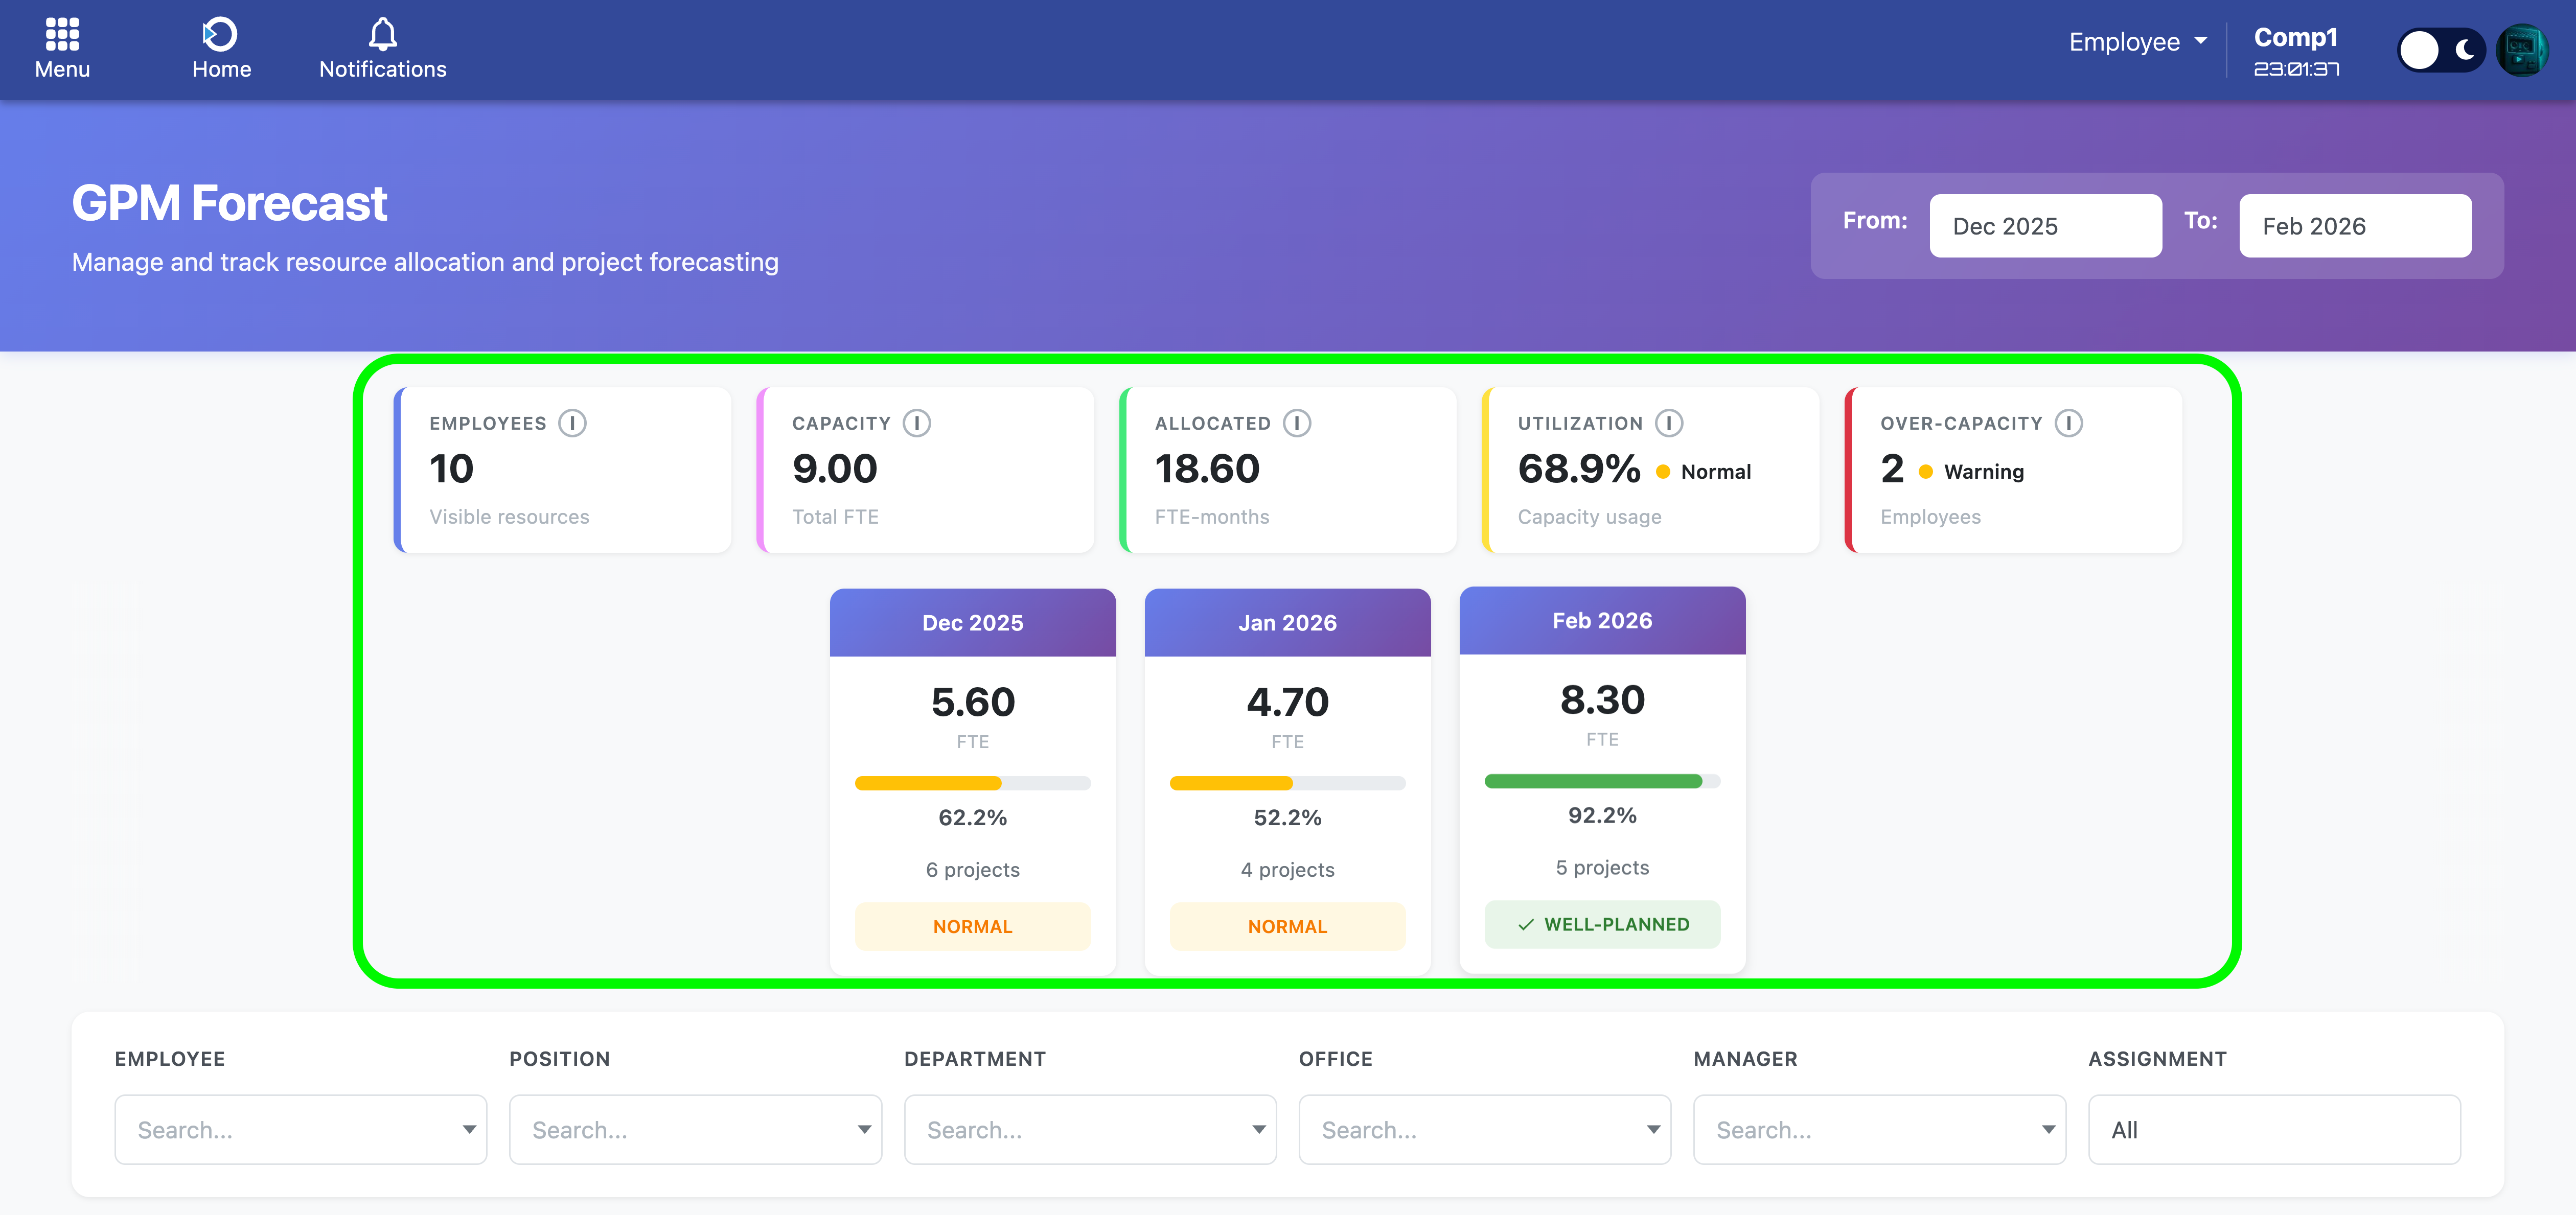
2.2 Global Statistics Cards
Four white cards displaying aggregated metrics across all visible employees after filters are applied.
| Card | Metric | Calculation |
|---|---|---|
| Employees | Count of visible employees | Each employee-position combination counts as one unit |
| Capacity | Total FTE available | Sum of FTE values for all visible employees (1.0 = full-time equivalent) |
| Allocated | Total FTE-months allocated | Sum of all FTE entries across all months and employees |
| Utilization | Percentage of capacity used | Allocated ÷ (Capacity × Number of Months) × 100% |
| Over-Capacity | Count of over-allocated employees | Number of employees with at least one month where total FTE allocation exceeds their capacity |
Utilization Status Indicators:
- Empty / Very Low (0-10%): Red indicator. Work planning required.
- Low (10-30%): Orange indicator. Additional work should be allocated.
- Normal (30-70%): Yellow indicator. Moderate capacity utilization.
- Well-planned (70-100%): Green indicator. Optimal allocation achieved.
- Over-allocated (>100%): Red indicator. Rebalancing required.
Over-Capacity Status Indicators:
- Perfect (0 employees): Green indicator. All employees within capacity limits.
- Warning (1-2 employees): Yellow indicator. Minor allocation issues requiring review.
- Critical (3+ employees): Red indicator. Significant workload rebalancing required.
Each card includes an information icon (i) that displays detailed calculation explanations when hovered.
Navigation: Global statistics section
2.3 Monthly Breakdown Cards
Horizontal scrollable section displaying individual month statistics. This section is hidden when viewing only one month.
Each monthly card contains:
- Month header: Display name (e.g., "Dec 2024")
- Allocated FTE value: Total FTE allocated for that specific month
- Progress bar: Visual representation of utilization percentage
- Utilization percentage: Numeric display of capacity usage
- Project count: Number of projects with work planned for that month
- Status badge: Color-coded indicator (Empty / Very Low / Low / Normal / Well-planned / Over-allocated)
Navigation: Monthly breakdown section
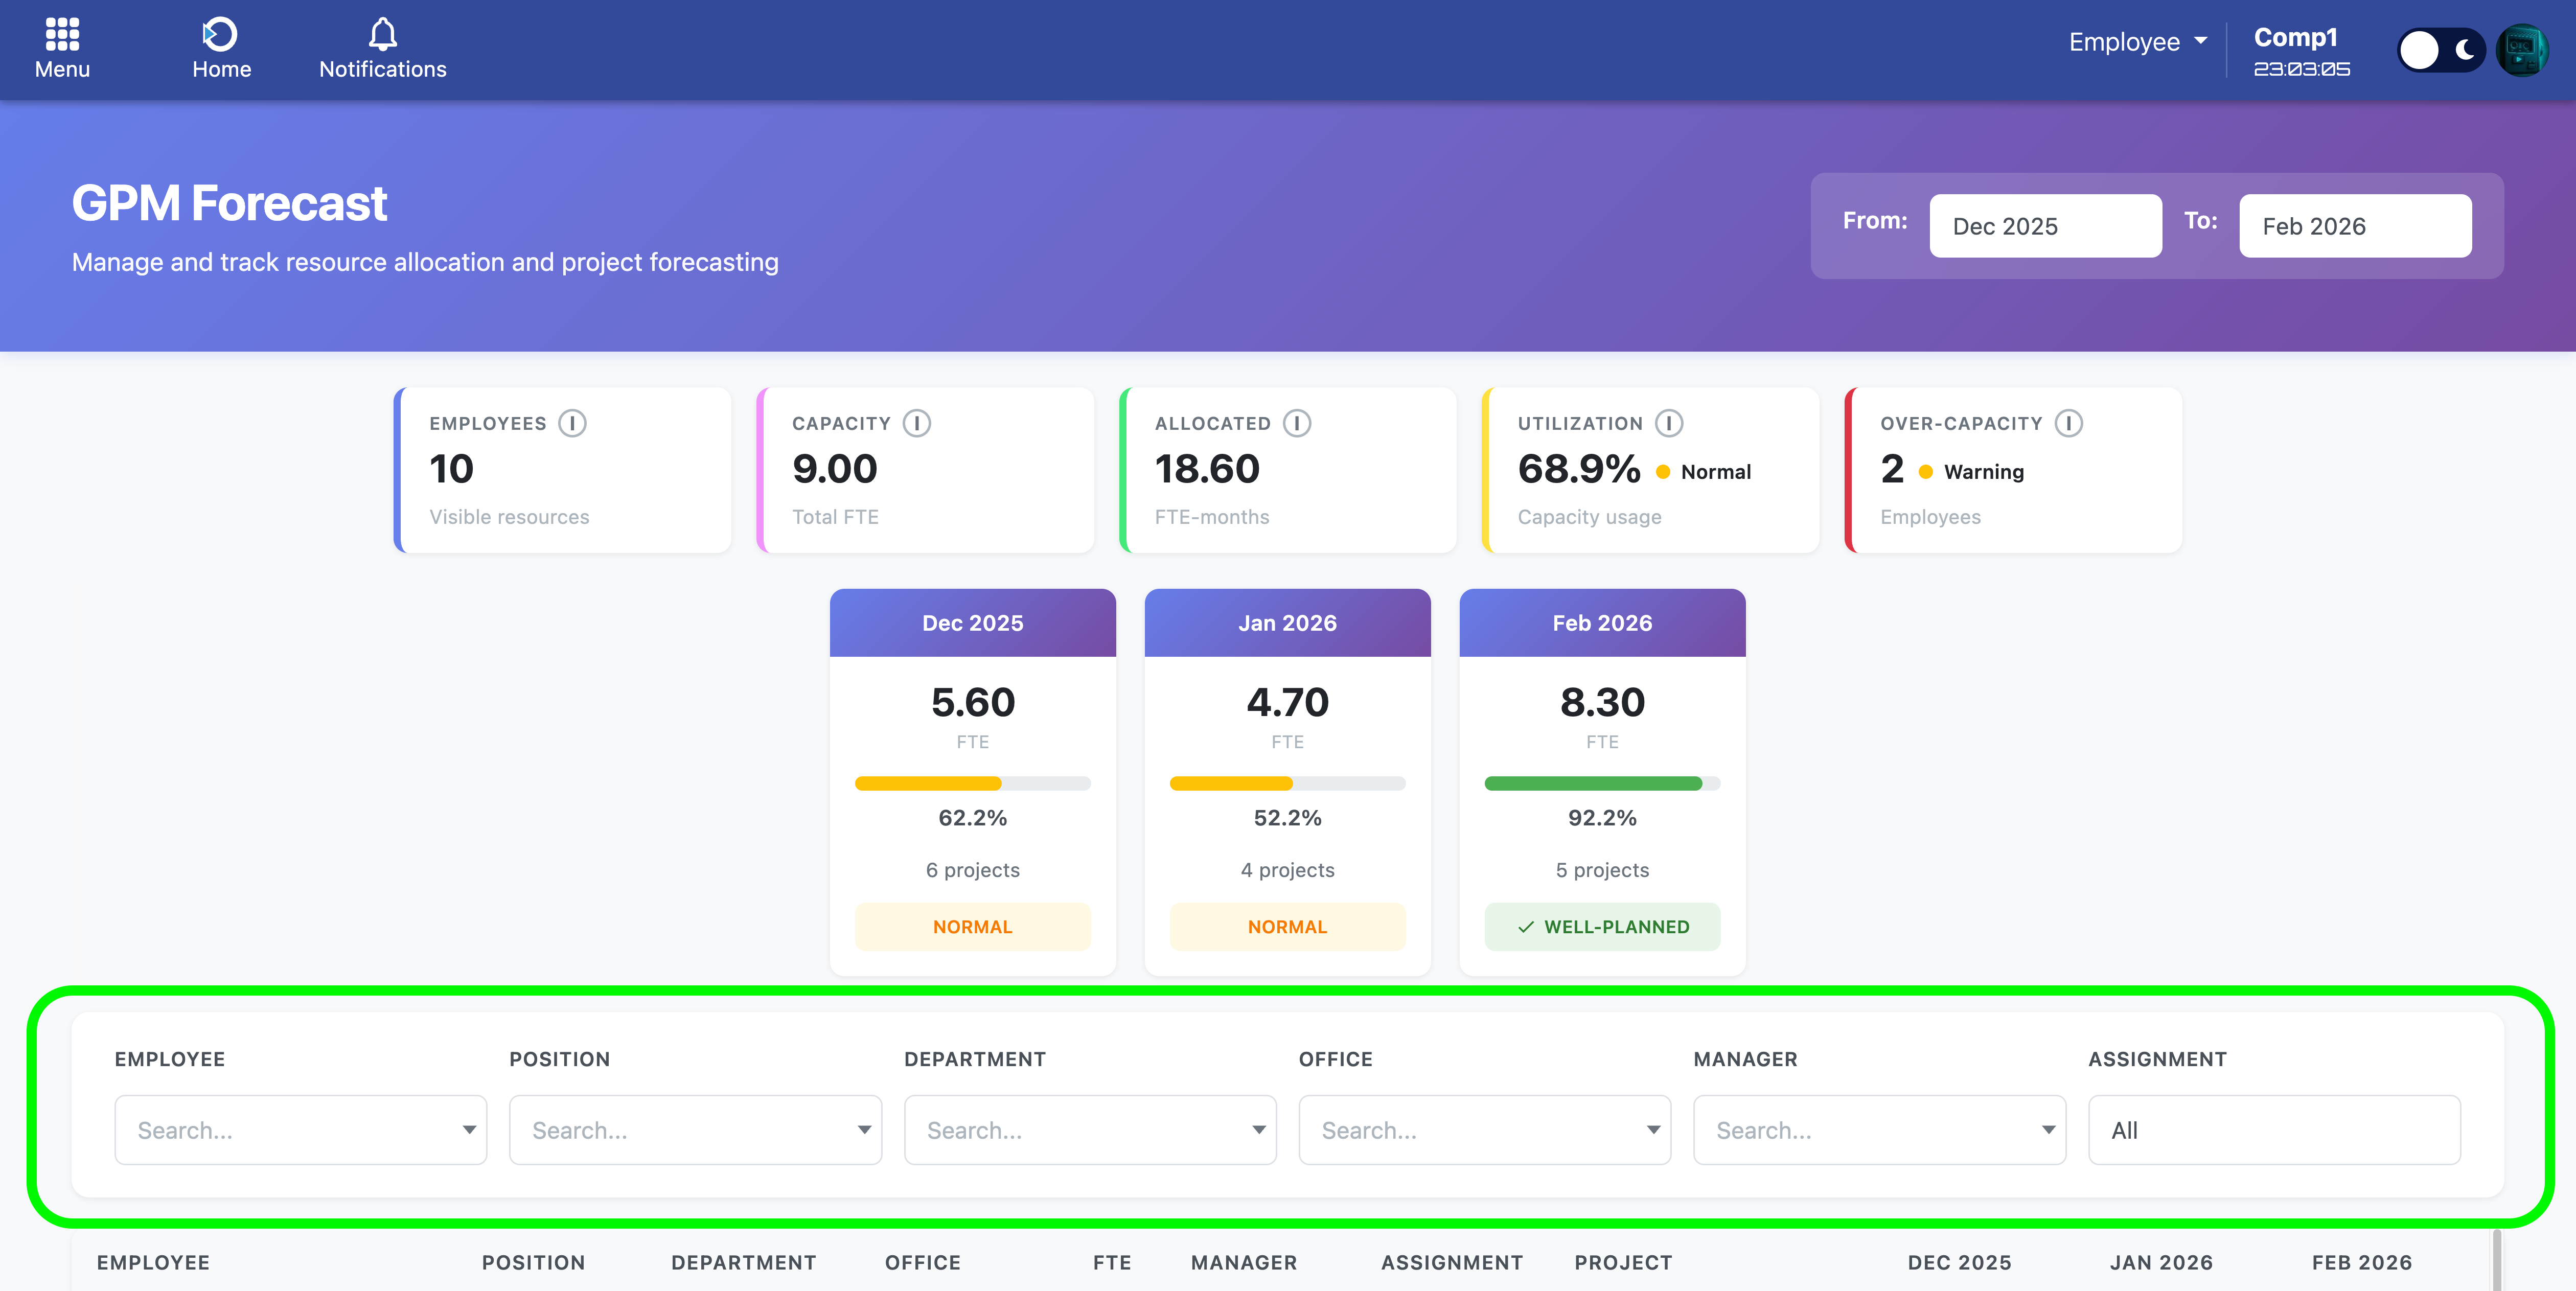
2.4 Filters Section
White section containing six filter controls arranged in a grid layout. All filters feature live search functionality and apply immediately without requiring a submit action.
| Filter | Description |
|---|---|
| Employee | Filter by specific employee name |
| Position | Filter by job position (e.g., "Developer", "Project Manager") |
| Department | Filter by department name |
| Office | Filter by office location |
| Manager | Filter by direct manager name |
| Assignment | Filter by assignment type (Primary or Secondary) |
Filter Usage:
- Click on any filter input to activate it.
- Type to search for available options (live search updates results dynamically).
- Click an option to select it.
- A red X button appears when a filter is active – click to clear the selection.
- Filters apply immediately and work together using AND logic.
- Statistics and visible data update automatically when filters change.
Navigation: Filters section
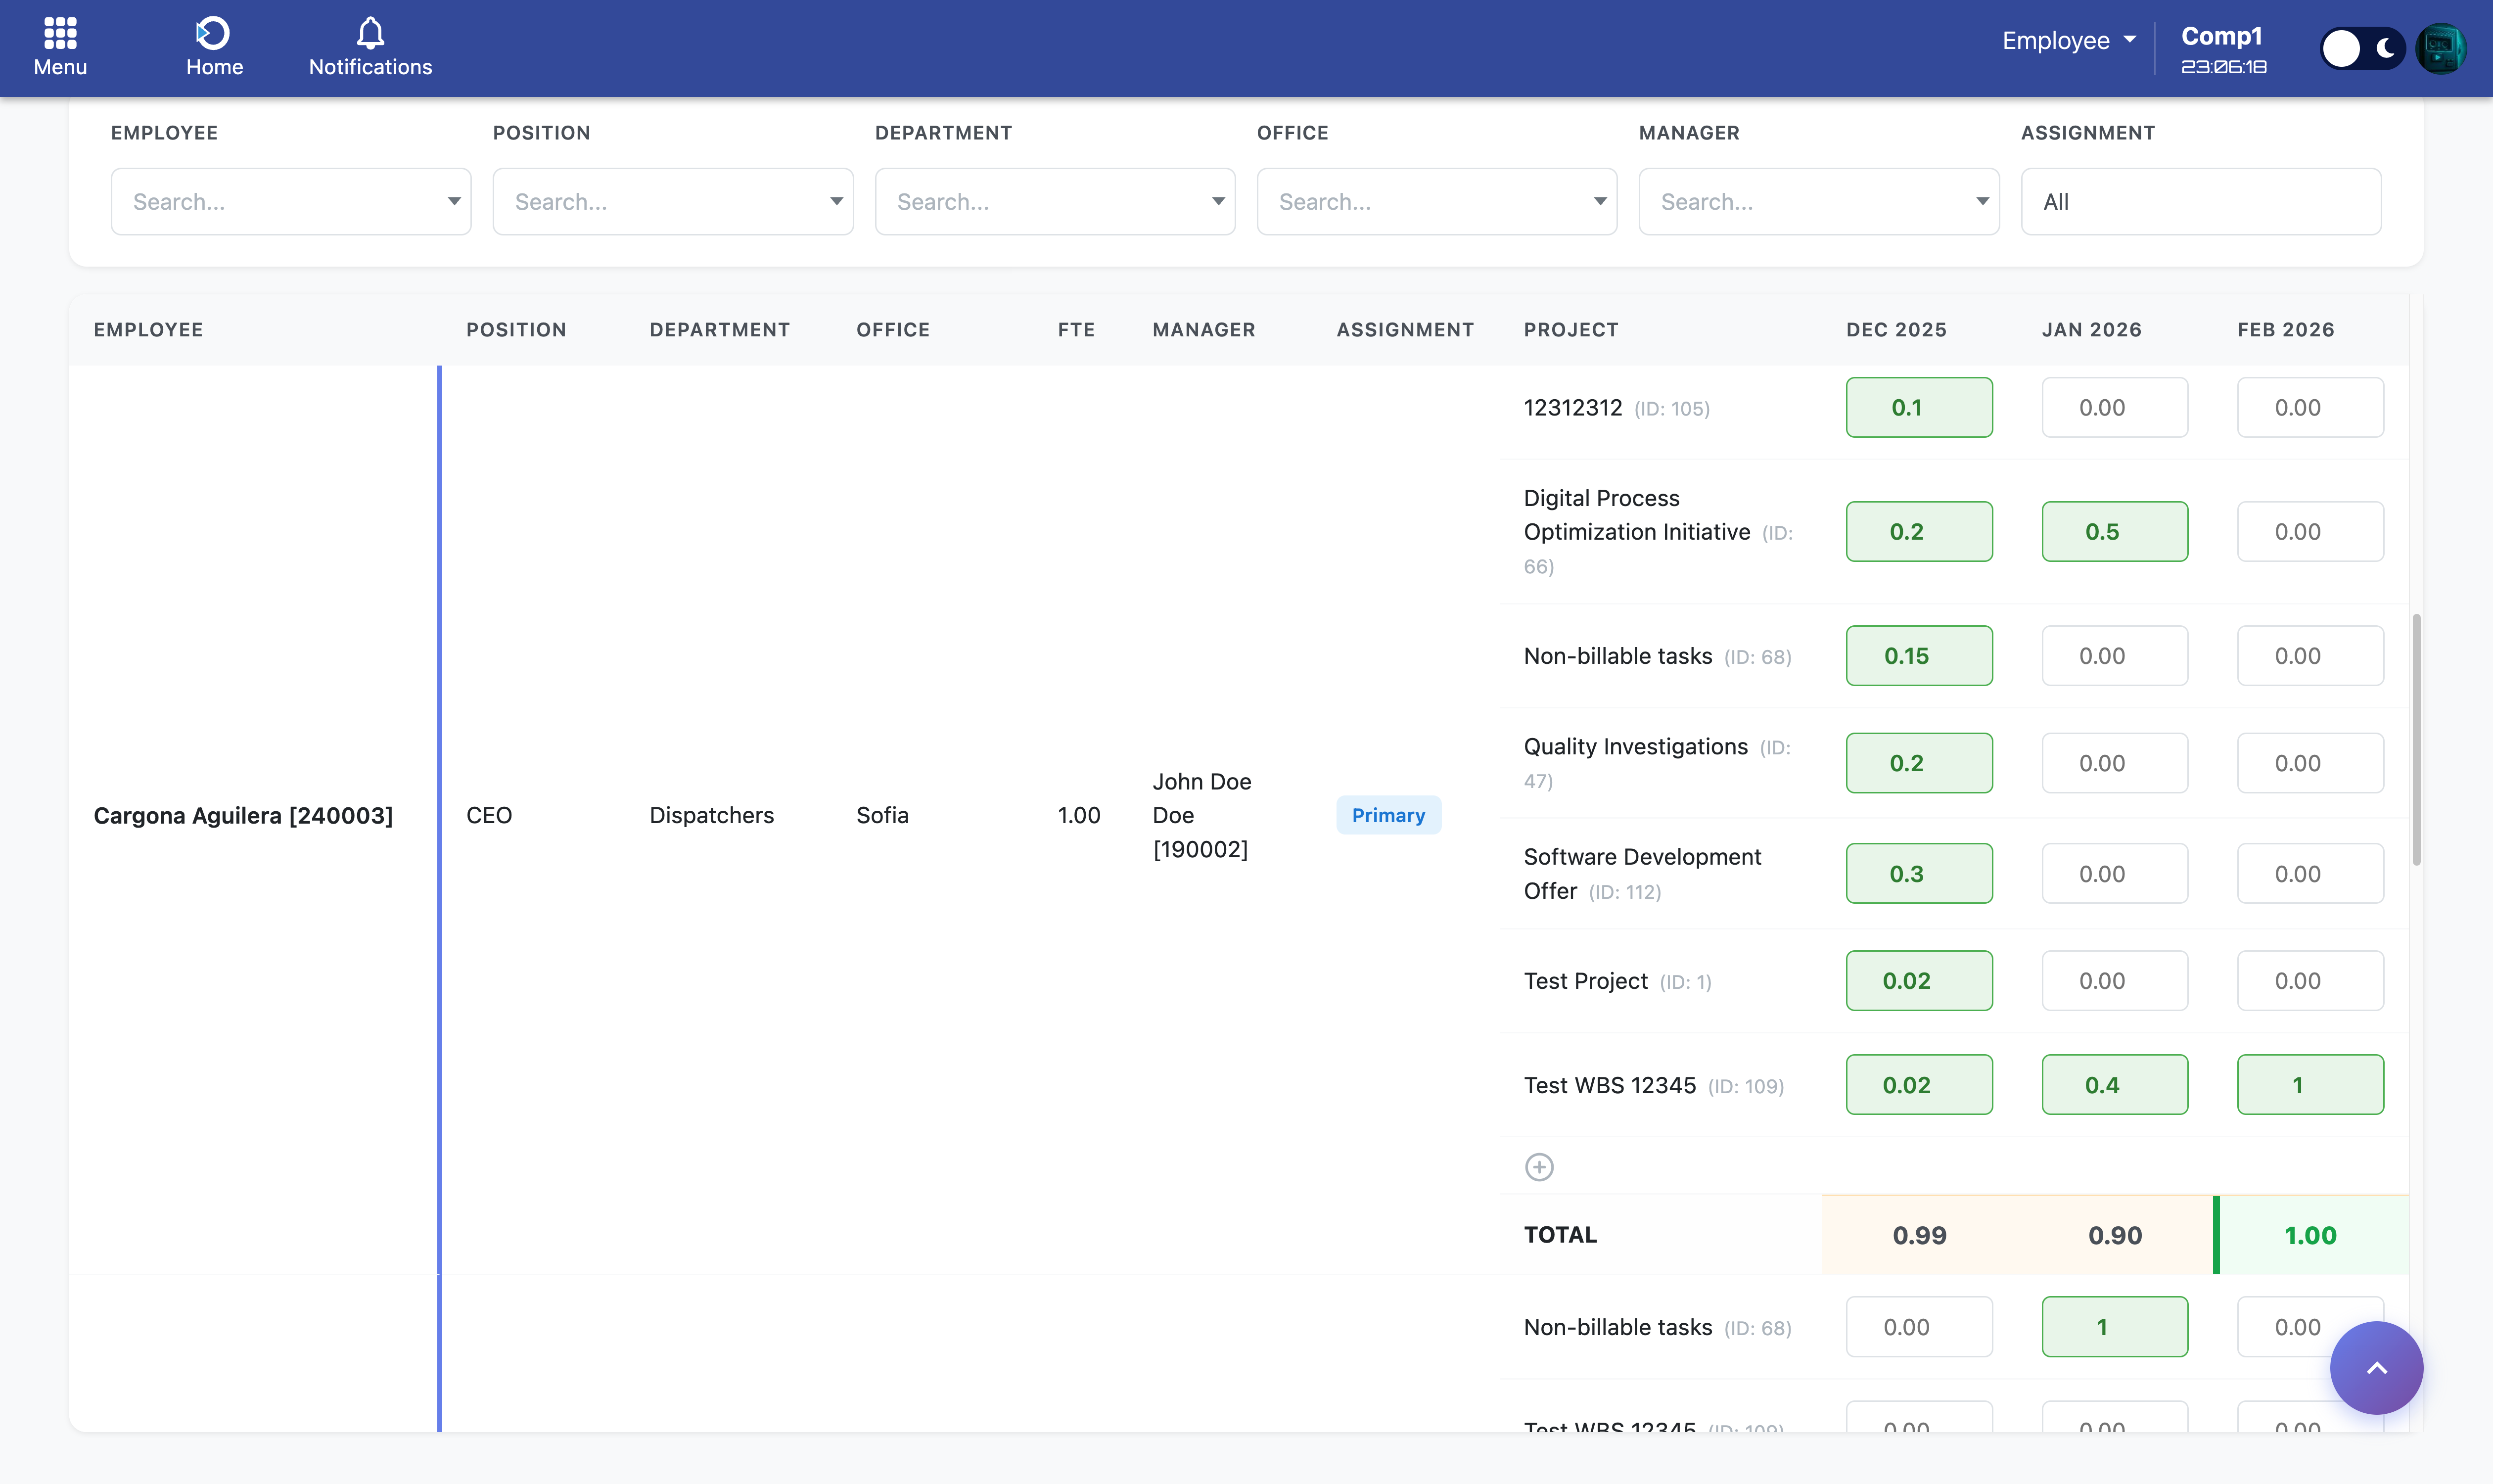
2.5 Main Data Table
The primary interactive component where forecast data is viewed and edited.
Table Column Structure:
| Column | Description |
|---|---|
| Employee | Full name of employee |
| Position | Job position with colored badge |
| Department | Department name |
| Office | Office location |
| FTE | Full-Time Equivalent capacity (1.0 = 100%) |
| Manager | Direct manager name |
| Assignment | Primary or Secondary assignment badge |
| Project | Project name with ID reference |
| Month Columns | One column per month with editable input fields |
Navigation: Main data table
3. Editing Forecast Data
3.1 Entering FTE Values
FTE (Full-Time Equivalent) values represent the percentage of an employee's time allocated to a specific project during a given month.
Valid FTE range: 0 to 1
- 0.00 = 0% of time (no allocation)
- 0.25 = 25% of time (approximately 1 week per month)
- 0.50 = 50% of time (approximately 2 weeks per month)
- 0.75 = 75% of time (approximately 3 weeks per month)
- 1.00 = 100% of time (entire month)
Important Note on Part-Time Employees:
Each employee has an FTE capacity shown in the "FTE" column. For example, a part-time employee with FTE = 0.5 can only be allocated up to 0.5 total per month across all projects. A full-time employee with FTE = 1.0 can be allocated up to 1.0 total per month. You cannot exceed an employee's FTE capacity without triggering over-capacity warnings.
Data Entry Process:
- Click on any month input field in the table.
- Enter a numeric value between 0 and 1.
- The system auto-saves immediately upon input.
- All data entered or deleted is saved automatically to the database.
Visual Feedback:
- White background: Empty field with no data
- Green background: Valid value entered
- Red background: Invalid value (outside 0-1 range)
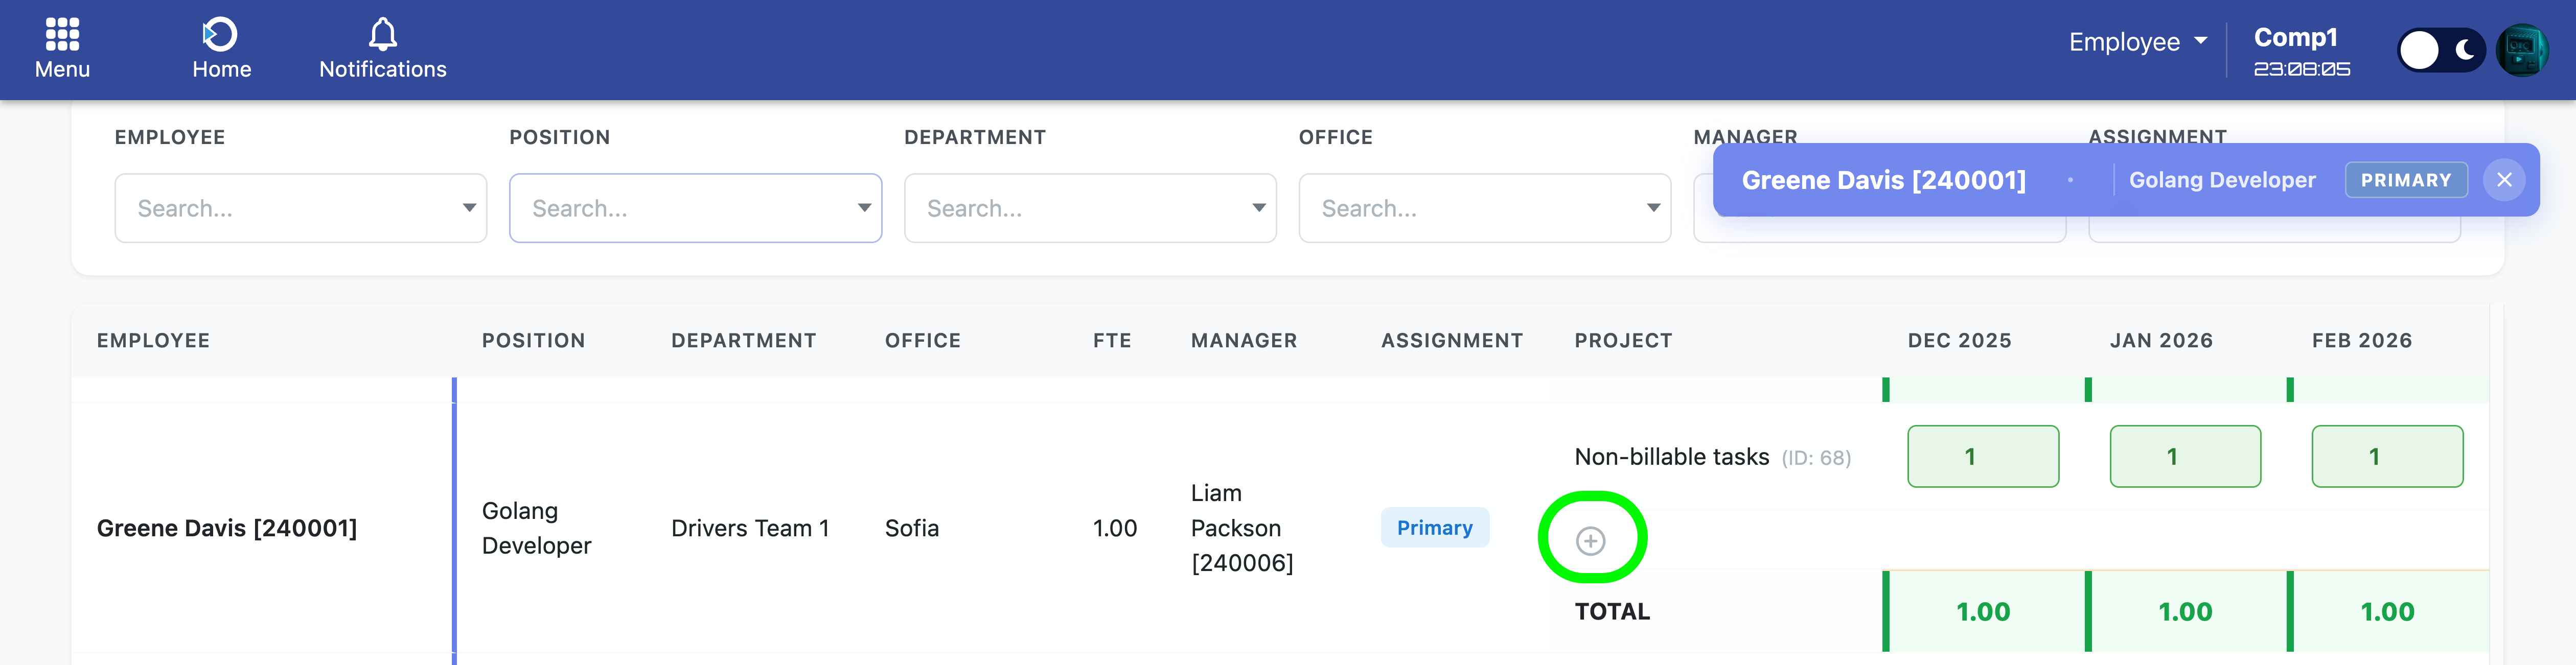
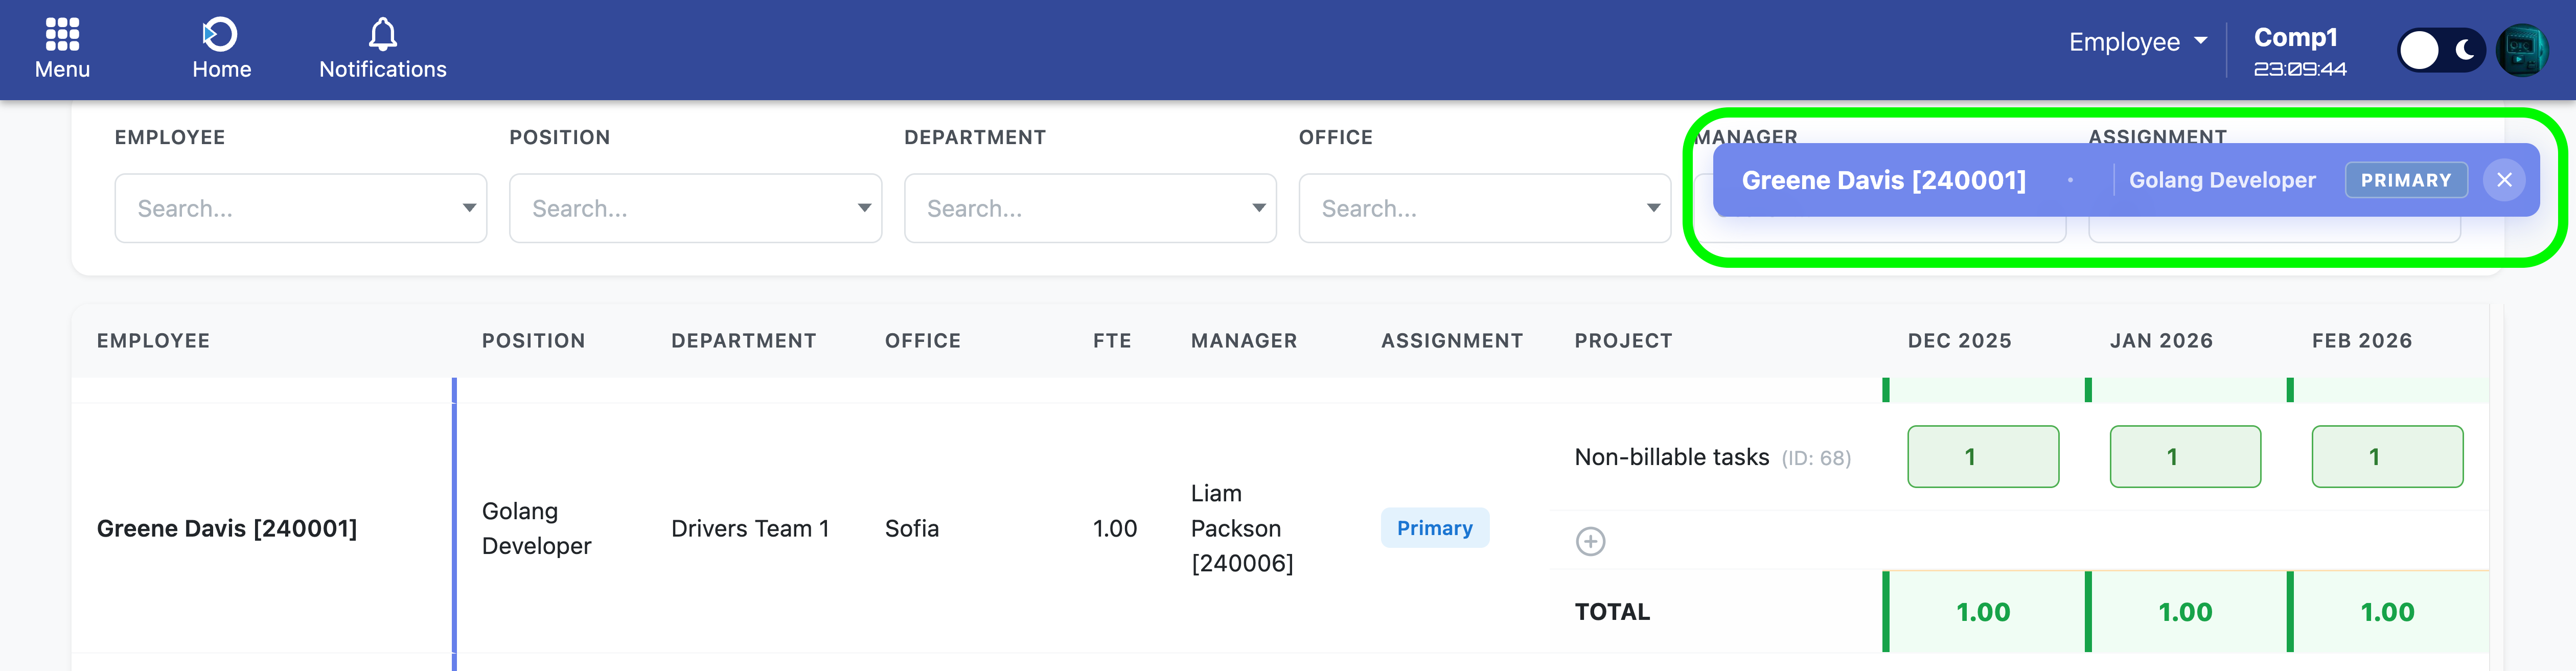
3.2 Understanding the TOTAL Row
Each employee has a TOTAL row that displays the sum of FTE allocations across all projects for each month. This row provides critical capacity warnings.
TOTAL Row States:
- Beige background: Normal state – total allocation is within capacity
- Green background with left border: Perfect capacity – exactly 100% utilization
- Red background with left border: Over capacity – allocation exceeds employee's FTE
- Amber top and bottom borders: Warning indicator – at least one month is over capacity
Hover Tooltips:
Hovering over TOTAL cells with capacity warnings displays detailed information:
- Over capacity: "Over capacity: +0.25 FTE (125% of 1.0)"
- Perfect capacity: "Perfect allocation: 100% of 1.0 FTE"
4. Keyboard Navigation
The table supports Excel-style keyboard navigation for efficient data entry without requiring mouse interaction.
| Key | Action |
|---|---|
| Arrow Up ↑ | Move to input field above (previous project or previous employee) |
| Arrow Down ↓ | Move to input field below (next project or next employee) |
| Arrow Left ← | Move to previous month (same employee, same project) |
| Arrow Right → | Move to next month (same employee, same project) |
| Enter ↵ | Move down to next input field |
| Shift + Enter | Move up to previous input field |
| Tab ⇥ | Move to next input field (browser default behavior) |
| Ctrl + Z (Windows) Cmd + Z (Mac) |
Undo last change |
When navigating with keyboard, the system automatically selects all text in the target input field for easy value replacement.
5. Undo Functionality
The undo feature allows you to revert the last change made to any FTE input field. Press Ctrl + Z (Windows) or Cmd + Z (Mac) to trigger the undo action.
Undo Behavior:
- Restores the previous value that was in the input field before your last edit
- Automatically saves the restored value back to the database
- Updates the TOTAL row to reflect the reverted change
- Maintains a stack of up to 50 changes during your session
- Shows "Nothing to undo" message if the undo stack is empty
- Shows "Undo failed" if there is a database error during the restoration
Note: The undo functionality only works for value changes made during your current session. It does not persist across page refreshes or browser closes.
6. Adding Projects to Employees
Each employee section includes an "Add Project" button that allows you to assign additional projects to that employee.
Add Project Process:
- Locate the employee in the table
- Find the row with the circle-plus icon (⊕) below their existing projects
- Click the icon to activate the project search interface
- A search box appears with a dropdown list of available projects
- Type to search for project names (live search filters results)
- Click on a project from the dropdown to select it
- A new project row appears immediately with empty month input fields
- Focus automatically moves to the first month input field
- Begin entering FTE values for the new project
Project Availability:
- Only active projects (not completed or cancelled) appear in the dropdown
- Projects already assigned to the employee are excluded from the list
- If no projects are available, a message indicates "No more projects available"
Navigation: Add Project interface
7. Floating Employee Badge
A purple floating badge appears in the top-right corner of the screen when scrolling through the table. This badge helps you track which employee's data is currently in view.
Badge Contents:
- Employee name: Full name of the currently visible employee
- Position title: Job position of the employee
- Assignment badge: Primary or Secondary assignment indicator
- Close button (X): Temporarily hide the badge
Badge Behavior:
- Appears automatically when you scroll past an employee's first project row
- Updates automatically as you scroll to different employees
- Can be closed by clicking the X button in the top-right corner of the badge
- Reappears when you scroll to a new employee (even after being closed)
- Tracks employee + position combination correctly (handles employees with multiple position assignments)
Navigation: Floating employee badge
8. Best Practices
8.1 Recommended Practices
- Use keyboard navigation for faster data entry across multiple months
- Monitor the TOTAL row continuously to avoid over-capacity allocations
- Use Ctrl+Z / Cmd+Z immediately after mistakes to maintain data accuracy
- Check global Utilization status before planning new work allocations
- Apply filters to focus on specific teams or departments when planning
- Hover over information icons (i) for detailed metric explanations
- Review monthly breakdown cards to identify underutilized or overloaded months
- Ensure allocations do not exceed employee FTE capacity per position
8.2 Practices to Avoid
- Do not enter values greater than 1.0 (100% capacity limit per assignment)
- Do not ignore over-capacity warnings (red TOTAL cells)
- Do not close the browser while data is being saved
- Do not allocate more than the employee's FTE capacity across all projects for a single month
- Do not rely on undo functionality for changes made in previous sessions
9. Troubleshooting Common Issues
| Issue | Solution |
|---|---|
| "Save failed" error appears | Check internet connection and attempt the entry again. If the issue persists, refresh the page and retry. |
| Input field turns red | Value must be between 0 and 1 inclusive. Enter a valid decimal number (e.g., 0.5 for 50%). |
| TOTAL row displays red background | Over capacity detected. Reduce FTE values for that month to bring total allocation within employee capacity. |
| Expected employee not showing in list | Verify the employee has time tracking obligation enabled and is part of your reporting hierarchy. |
| Project missing from "Add Project" dropdown | Project may already be assigned to the employee or is marked as completed/cancelled. |
| Changes not visible after saving | Refresh the page (F5) to reload the latest data from the database. |
| Undo not working | Verify you have not exceeded 50 changes (undo stack limit) or check if undo stack was cleared by page refresh. |
| Monthly breakdown cards not showing | Monthly breakdown section is hidden when viewing only one month. Expand date range to see monthly cards. |
10. Summary
- Project Resource Forecast provides comprehensive capacity planning for your entire reporting hierarchy
- View and edit FTE allocations across projects and months in a single interface
- Visual warnings alert you to over-capacity situations in real-time
- Keyboard navigation and undo functionality enable efficient data entry
- Six filters allow focused views of specific teams, departments, or positions
- All data entered or deleted is saved immediately to the database
- Global and monthly statistics provide high-level utilization insights
- Add new projects dynamically without leaving the interface
- Floating employee badge maintains context awareness during scrolling
11. Delegating Access Rights
Managers can delegate their resource planning rights to other employees, allowing trusted team members to manage forecasts and view reports on their behalf. This is particularly useful during periods of absence, when distributing workload, or when empowering senior team members with planning responsibilities.
11.1 How Delegation Works
When you delegate access to an employee, that person gains the ability to see and manage your entire reporting hierarchy for the selected module. This means they can:
- View all subordinates: See all employees who report to you (directly and indirectly)
- Edit forecast data: Enter and modify FTE allocations for your team members
- Add projects: Assign new projects to employees in your hierarchy
- View reports: Access detailed capacity reports and utilization metrics
- See themselves: The delegated employee will also appear in the employee list (as they become part of your subordinate tree)
11.2 Setting Up Delegation
Step-by-step process:
- Navigate to the Control Panel from the main menu
- Click on the Delegation section
- Select the module you want to delegate:
- Project Resource Forecast - Allows editing of team member allocations and project planning
- Employee Resource Overview - Allows viewing of detailed capacity reports and utilization analytics
- Select the employee you want to grant access to
- Save the delegation
Important notes:
- You can delegate access to multiple employees for the same module
- You can delegate different modules to different employees (one person for forecasting, another for reporting)
- Delegations are module-specific - granting access to Project Resource Forecast does not automatically grant access to Employee Resource Overview
- The delegated employee receives the same view you would see, including your entire reporting hierarchy
- You retain full access to your modules even after delegating
11.3 Removing Delegation
To revoke delegation rights:
- Return to Control Panel > Delegation
- Locate the delegation entry you want to remove
- Delete the delegation record
- The employee immediately loses access to your team's data for that module
11.4 Use Cases for Delegation
| Scenario | Recommended Delegation |
|---|---|
| Vacation or extended absence | Delegate both Project Resource Forecast and Employee Resource Overview to a trusted deputy |
| Large team management | Delegate Project Resource Forecast to senior team leads who manage sub-teams |
| Resource planning specialist | Delegate Project Resource Forecast to a dedicated resource planner or project coordinator |
| Reporting and analytics | Delegate Employee Resource Overview to HR or operations team members who need visibility into utilization metrics |
| Cross-functional collaboration | Delegate to department heads who need insight into resource availability for joint projects |
Security reminder: Only delegate access to employees you trust with sensitive team resource information. Delegated users have the same level of access you do for the selected module.